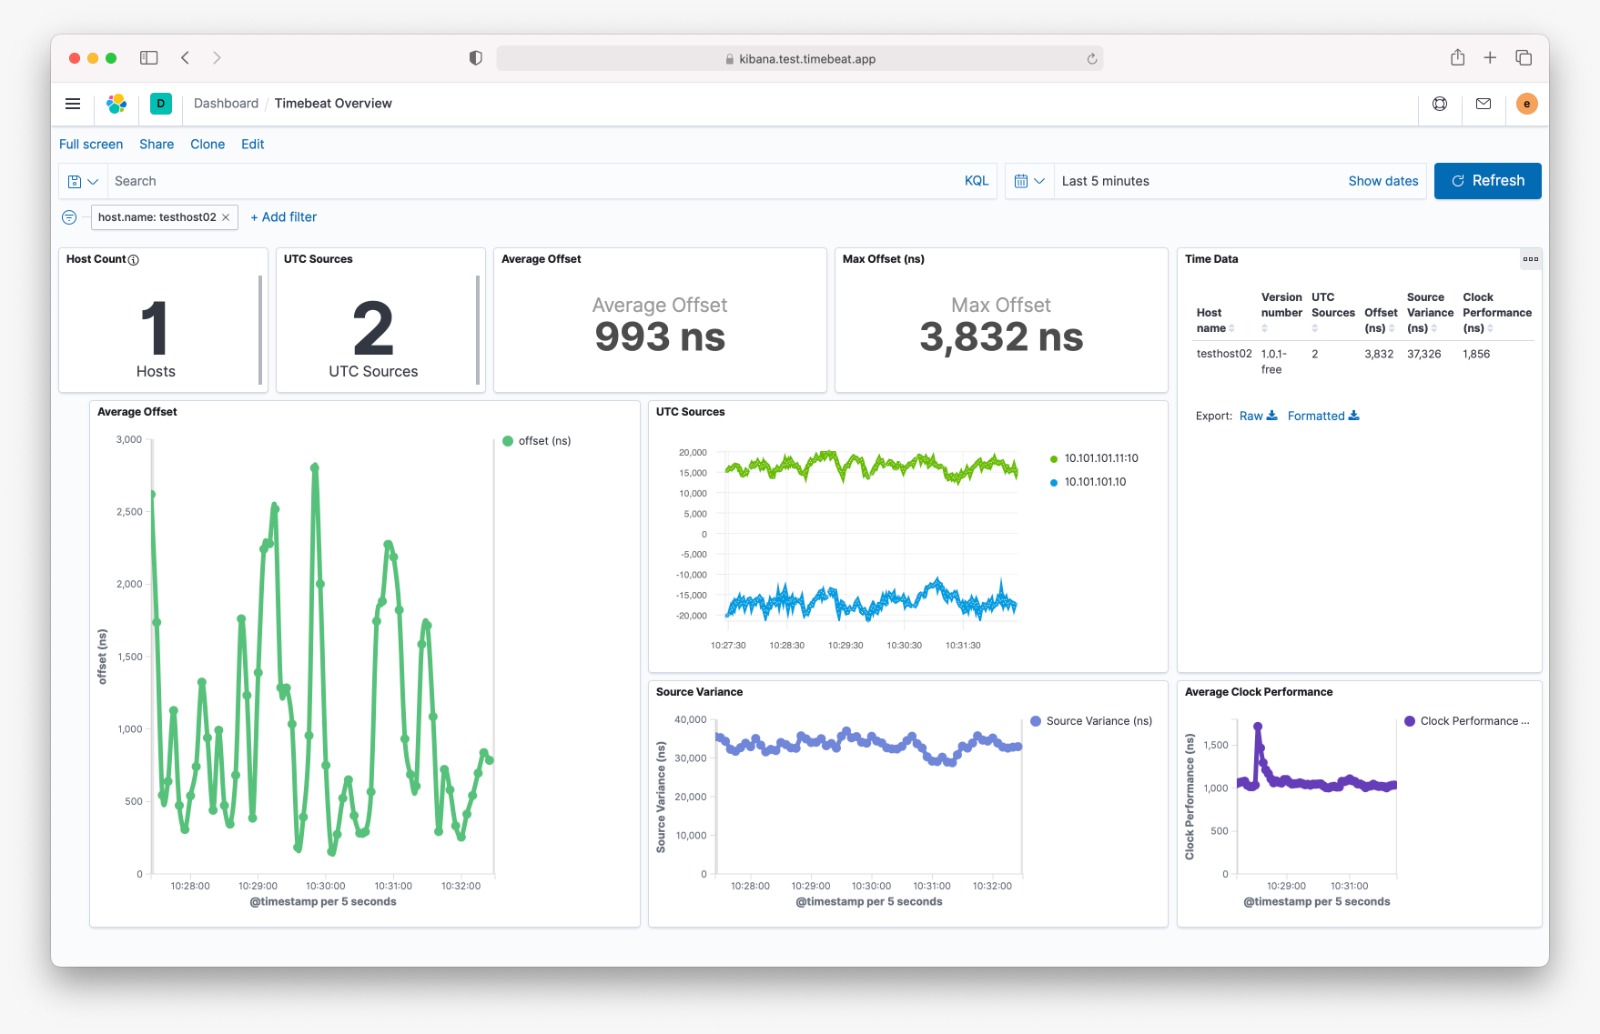
Timebeat ships out with a data-rich Kibana dashboard enabling you to start visualising your data and clock synchronisation as soon as your application starts.
Configuring Timebeat to deploy the dashboard
Within the timebeat.yml configuration file, there is a subsection that allows you to set up the dashboard which will load into Kibana upon start-up of the Timebeat service.
# =================================== Kibana ===================================

# Starting with Beats version 6.0.0, the dashboards are loaded via the Kibana API.
# This requires a Kibana endpoint configuration.
setup.kibana:

  # Kibana Host
  # Scheme and port can be left out and will be set to the default (http and 5601)
  # In case you specify and additional path, the scheme is required: http://localhost:5601/path
  # IPv6 addresses should always be defined as: https://[2001:db8::1]:5601
  #host: "localhost:5601"

  # Optional protocol and basic auth credentials.
  #protocol: "https"
  #username: "elastic"
  #password: "changeme"
The first step is to let the Timebeat application know where your Kibana system is located.
For this simply uncomment the line which starts with host: "localhost:5601" and modify localhost to the correct details for the IP address of your Kibana server. Kibana deploys on port 5601 by default however if you have changed this you will need to modify the port number to match.
Once you have the above configured, now we can let Timebeat know where the default dashboard is located.
# ================================= Dashboards =================================

# These settings control loading the sample dashboards to the Kibana index. Loading
# the dashboards are disabled by default and can be enabled either by setting the
# options here, or by using the `-setup` CLI flag or the `setup` command.
#setup.dashboards.enabled: true

# The directory from where to read the dashboards. The default is the `kibana`
# folder in the home path.
#windows directory path.
#setup.dashboards.directory: ${path.home}\kibana

#Linux directory path.
#setup.dashboards.directory: ${path.home}/kibana

# The URL from where to download the dashboards archive. It is used instead of
# the directory if it has a value.
#setup.dashboards.url:
The simplest method to deploy the Kibana dashboard is to uncomment the setup.dashboard.enabled line and the setup.dashboards.directory: line which matches the operating system you are installing on.
If you move the default dashboard from the install location then you will need to change the path directory to match its new location.
It is recommended that only one device is configured to ship the dashboard to Kibana however it will not cause problems if more are configured.
If you modify the dashboard it is highly recommended to save the modified dashboard as a separate dashboard with a new name, this is because in the event Timebeat is restarted or a new device is deployed with the active dashboard configuration as detailed above all changes will be lost and the dashboard is overwritten to the dashboard on file.