This recipe will provide a step-by-step guide to setting up a complete monitoring system with a rich dashboard environment. The goal of this process will be that at the end of which you can deploy your own dashboard-rich PTP monitoring system with the steps learned in this and tailor it to your needs.
Problem:
You want to be able to visualise your synchronisation environment and monitor devices synchronising to PTP.
Ingredients (the minimum required items)
- A PTP timing network set up
- A device capable of operating as the database and dashboard hosting environment (Linux in this example)
- A Local Area Network
- An internet browser
- Access to the internet
Total Prep time: 15 mins, Total Cook time: 15 mins
In this recipe, we will use the basic PTP timing network set up in the previous recipe (link to recipe)
Step 1:
SSH to the Linux device and start running the following commands.
It is important to let each command end before starting the next.
$ sudo dnf install -y snapd

$ sudo ln -s /var/lib/snapd/snap /snap

$ sudo snap install microk8s --classic

$ sudo /snap/bin/microk8s enable dns
$ sudo /snap/bin/microk8s enable hostpath-storage
$ sudo /snap/bin/microk8s enable helm3
Step 2:
It is important to note that for this step we will need to know the IP address of the interface we wish data to be received.
A simple command below will show us the IP addresses and interfaces for us to select the one we need.
ip a
1: lo: <LOOPBACK,UP,LOWER_UP> mtu 65536 qdisc noqueue state UNKNOWN group default qlen 1000
    link/loopback 00:00:00:00:00:00 brd 00:00:00:00:00:00
    inet 127.0.0.1/8 scope host lo
    valid_lft forever preferred_lft forever
    inet6 ::1/128 scope host
    valid_lft forever preferred_lft forever
2: ens1: <NO-CARRIER,BROADCAST,MULTICAST,UP> mtu 1500 qdisc mq state DOWN group default qlen 1000
    link/ether 40:a6:b7:91:5e:9d brd ff:ff:ff:ff:ff:ff
    altname enp7s0
3: eno1: <BROADCAST,MULTICAST,UP,LOWER_UP> mtu 1500 qdisc mq state UP group default qlen 1000
    link/ether 5c:ba:2c:25:36:62 brd ff:ff:ff:ff:ff:ff
    altname enp2s0f0
    inet 10.101.101.33/24 brd 10.101.101.255 scope global noprefixroute eno1
    valid_lft forever preferred_lft forever
    inet6 fe80::5eba:2cff:fe25:3662/64 scope link noprefixroute
    valid_lft forever preferred_lft forever
4: eno2: <NO-CARRIER,BROADCAST,MULTICAST,UP> mtu 1500 qdisc mq state DOWN group default qlen 1000
    link/ether 5c:ba:2c:25:36:63 brd ff:ff:ff:ff:ff:ff
    altname enp2s0f1
5: eno3: <NO-CARRIER,BROADCAST,MULTICAST,UP> mtu 1500 qdisc mq state DOWN group default qlen 1000
    link/ether 5c:ba:2c:25:36:64 brd ff:ff:ff:ff:ff:ff
    altname enp2s0f2
6: eno4: <NO-CARRIER,BROADCAST,MULTICAST,UP> mtu 1500 qdisc mq state DOWN group default qlen 1000
    link/ether 5c:ba:2c:25:36:65 brd ff:ff:ff:ff:ff:ff
    altname enp2s0f3
7: VLAN55@eno4: <NO-CARRIER,BROADCAST,MULTICAST,UP> mtu 1500 qdisc noqueue state LOWERLAYERDOWN group default qlen 1000
    link/ether 5c:ba:2c:25:36:65 brd ff:ff:ff:ff:ff:ff
8: VLAN50@eno4: <NO-CARRIER,BROADCAST,MULTICAST,UP> mtu 1500 qdisc noqueue state LOWERLAYERDOWN group default qlen 1000
    link/ether 5c:ba:2c:25:36:65 brd ff:ff:ff:ff:ff:ff
In the above example we are interested in eno1. So we will make a mental note of the ip address 10.101.101.33
$ sudo /snap/bin/microk8s enable metallb

During this step you will be asked to insert an IP address.
This will be in the format of "IPaddress-SameIPaddress" see above example.
Now that we know the IP address when prompted we can enter it as follows:
10.101.101.33-10.101.101.33
(note we write it twice with a hyphen in the middle).
Step 3:
Now we just complete the installation with the Timebeat helm charts.
$ sudo /snap/bin/microk8s helm3 repo add timebeat https://timebeat.app/chart/
$ sudo /snap/bin/microk8s helm3 install timebeat timebeat/timebeat-backend-chart
Once complete elastic and grafana will be available for logging and data visualisation.
Step 4:
Let's check to make sure our services are running. For this, we use one of the basic kubectl commands.
$ sudo /snap/bin/microk8s kubectl get all --all-namespaces
The output should look similar to the below:
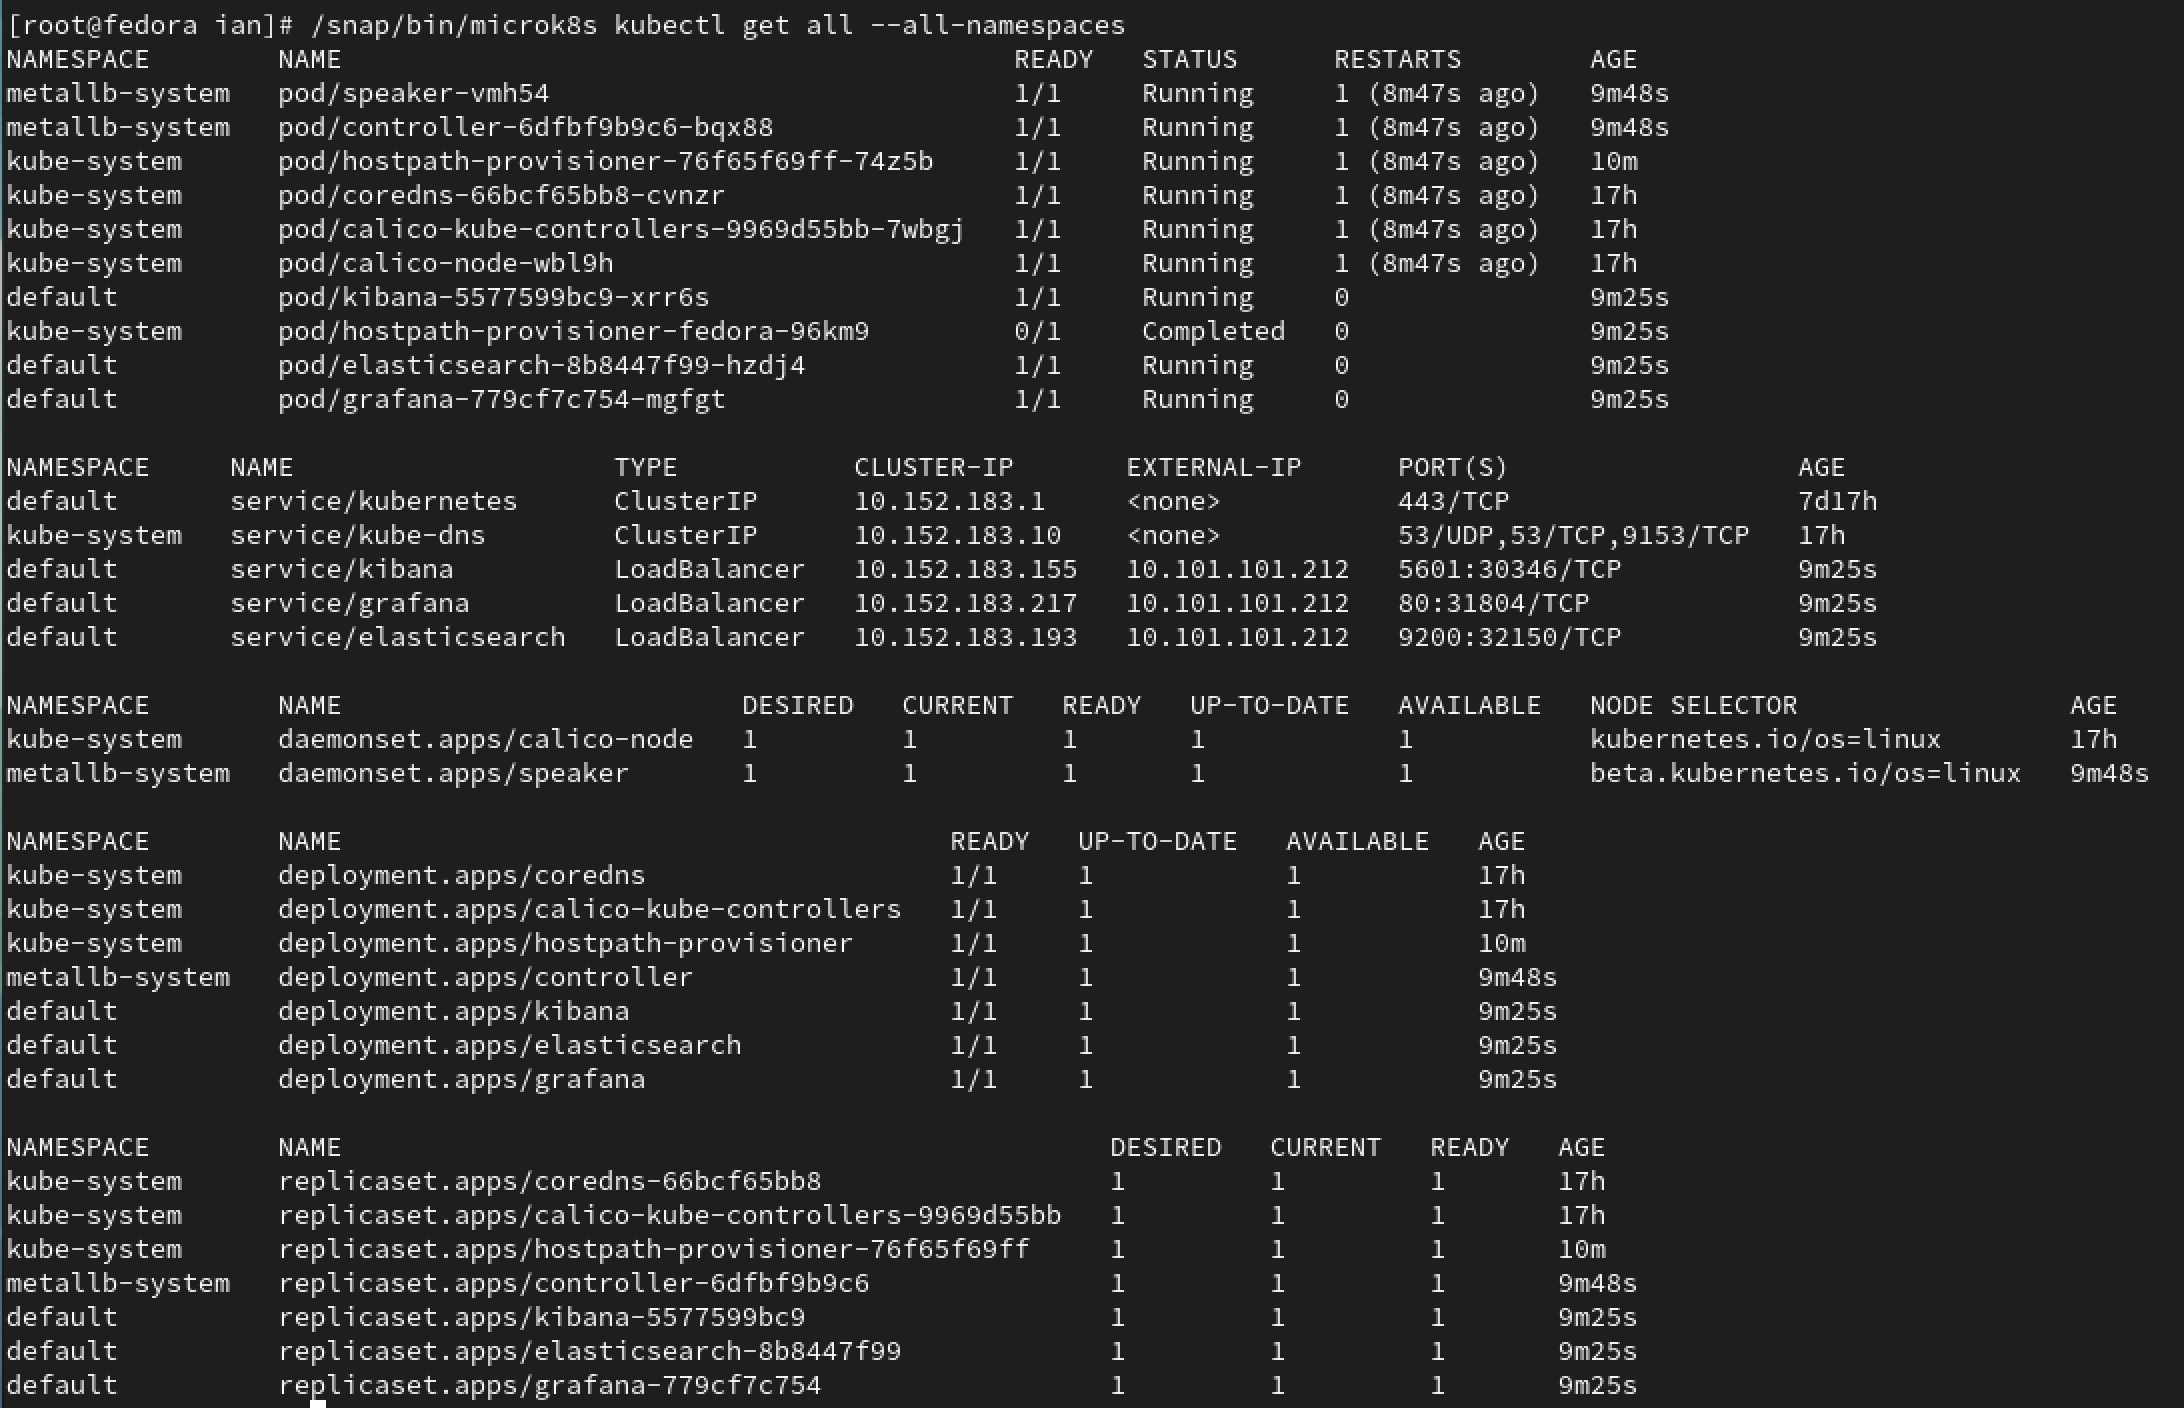
We can see at the bottom of the first batch of items we have a grafana pod and elasticsearch pod running.
Step 5:
Now lets send some data to our database.
For this we will log into one of our devices from our previous recipe, lets's use the device receiving PTP.
SSH or log into your receiving device to configure the data output section. For timebeat software and grandmasters we SSH to the console and then access the config file:
LINUX:
root@localhost ~]# vi /etc/timebeat/timebeat.yml
WINDOWS:
Open up the timebeat.yml file using notepad or similar from your installation directory (typically recommended program files --> Timebeat....)
Step 6:
Now we modify the outputs section of the config file
Specifically, we want to send data to our elasticsearch database. So remember the IP address from step 2, we will enter this into line 380 followed by port 9200. And that is that.
377    # ---------------------------- Elasticsearch Output ----------------------------
378    output.elasticsearch:
379    # Array of hosts to connect to.
380    hosts: ['10.101.101.33:9200'] # insert ip address of your elastic server
381    # hosts: ['elastic.customer.timebeat.app:9200'] # host format when using timebeat cloud
382
383    # Protocol - either `http` (default) or `https` (https is required for timebeat cloud).
384    #protocol: 'https'
385
386    # Authentication credentials - either API key or username/password. Must match your elastic details, only applicable if configured in elastic.
387    #api_key: 'id:api_key'
388    #username: 'elastic'
389    #password: 'changeme'
390
391    # Timebeat Cloud PKI connectivity details
392
393    # ssl.certificate_authorities: ['/etc/timebeat/pki/ca.crt']
394    # ssl.certificate: '/etc/timebeat/pki/timebeat.crt'
395    # ssl.key: '/etc/timebeat/pki/timebeat.key'
396    # ssl.verification_mode: "certificate"
397
398    # setup.ilm.rollover_alias: "timebeat"
Once complete save the config file, quit the file, and then restart the timebeat service on the receiving device so that it now sends data to the database.
:wq!
root@fedora ~]# systemctl restart timebeat
Step 7:
Let's check out the dashboards.
For this, we open up an internet browser and direct it the IP address as before but use port 80 (It is important to note, you must be on the same network for this to work, otherwise more network configuration is required).
So for us it is: 10.101.101.33:80
We are greeted with a login page for our dashboards, by default this will be:
username: admin
password: admin
(you will be prompted to change the password upon first login.)
Once logged In you can explore all your sync metrics and performance.